


WooCommerce Analytics gives online store owners clear insights into sales, customer behavior and product performance. By using detailed reports, charts and performance metrics, you can make better decisions based on real data rather than assumptions. In today’s competitive ecommerce world, understanding how customers behave is essential for growing your business.
Modern WooCommerce versions include an advanced analytics section. Below you’ll find a clear overview of every available report, along with tips to help you make the most of your analytics data and your WooCommerce analytics dashboard.
Background
Knowing the trends and preferences of customers is a dream of every seller, especially e-commerce sellers. The days when it was enough to run a simple shop are long gone. In the era of strong competition and a multitude of sales websites, a good offer and a shop may not be enough. Sales can be boosted by accurate decisions based on hard data.
The latest versions of WooCommerce offer a new analytics section. In this article, we take a detailed look at all the reports available in this section. Especially:
- Where to start with WooCommerce Analytics?
- Overview
- Products
- Revenue
- Orders
- Variations
- Categories
- Coupons
- Taxes
- Downloads
- Stock
- Settings
Where to start with WooCommerce Analytics?
The analytics tools are available in the WordPress admin panel. Simply go to the menu, then select the Analytics tab. You will have the following tabs to choose from, which we will present in turn:
Overview
When you click on this section, the Overview page will appear. Here you will find data that you can analyze within a date range of your choice. There are many preset ranges to choose from such as last week, month, quarter, year and many more. In the Preliminary section, you can select the following options:
- Today
- Yesterday
- Week to Date
- Last Week
- Month to Date
- Last Month
- Quarter to Date
- Last Quarter
- Year to Date
- Last Year
Within each of the ranges listed, you can choose to compare against the previous period or previous year.
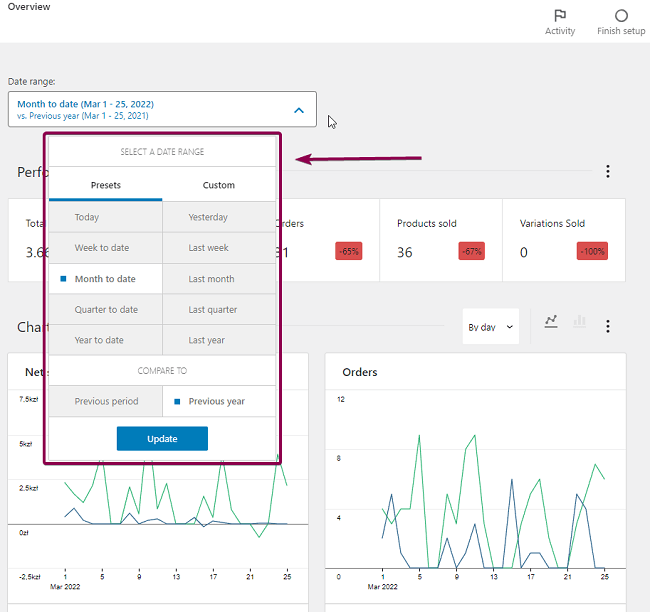
If you do not want to use any of the suggested ranges, you can select the custom option. You will be able to manually enter your own date range or select a date from the calendar.
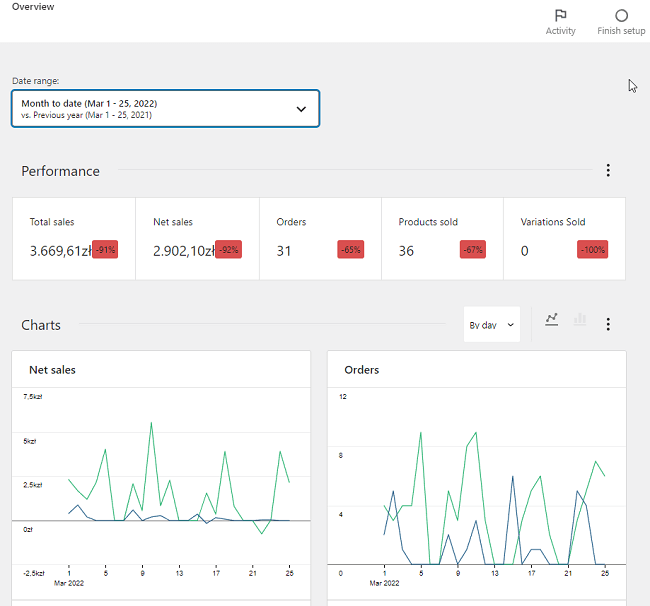
There are three sections here – Performance, Charts and Leaderboards. Let’s discuss each of these in more detail.
Performance
By default, the Performance section is displayed below the date range. In the first view you have the following data: total sales, net sales, orders, product sold and variations sold.
By selecting a specific value you will be taken to more detailed graphs. Thus, by selecting total sales, you will be taken to a specific chart covering the selected date range.
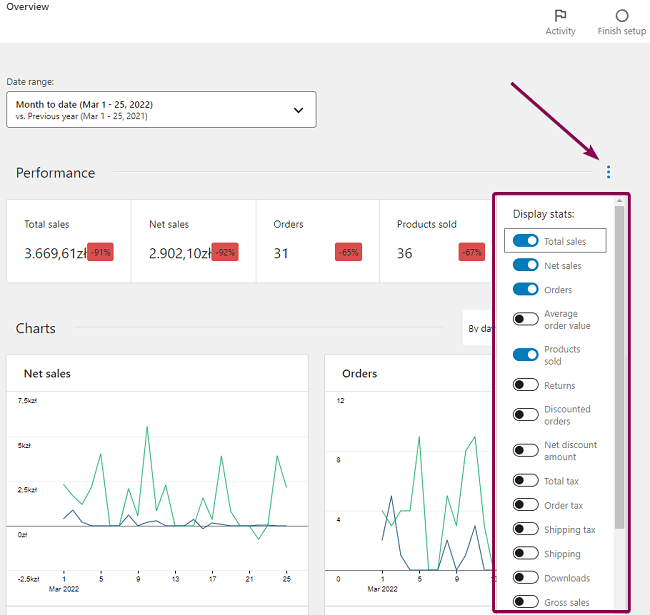
If you want to see other statistics, go to the right side and select the icon of an ellipsis, under which the full performance menu is hidden.
You will get a full list of statistical metrics that you can add to the main Overview panel. These are:
- Average order value
- Returns
- Discounted Orders
- Net discounted amount
- Total tax
- Order tax
- Shipping tax
- Shipping
- Downloads
- Gross Sales
Charts
WooCommerce analytics offers another block where you can see the charts. By default, charts are available for Net Sales and Orders. Similarly to Performances, also Charts have an ellipsis on the right, if you need more metrics. Thanks to this, you can add other charts to the general view, i.e:
- Total sales
- Average Order Value
- Items Sold
- Returns
- Discounted Orders
- Gross Discounted
- Total Tax
- Order Tax
- Shipping Tax
- Shipping
- Downloads
You may use line and circle charts to present data.
You can also select which statistics you want to display on this page. The following options are available.
Leaderboards
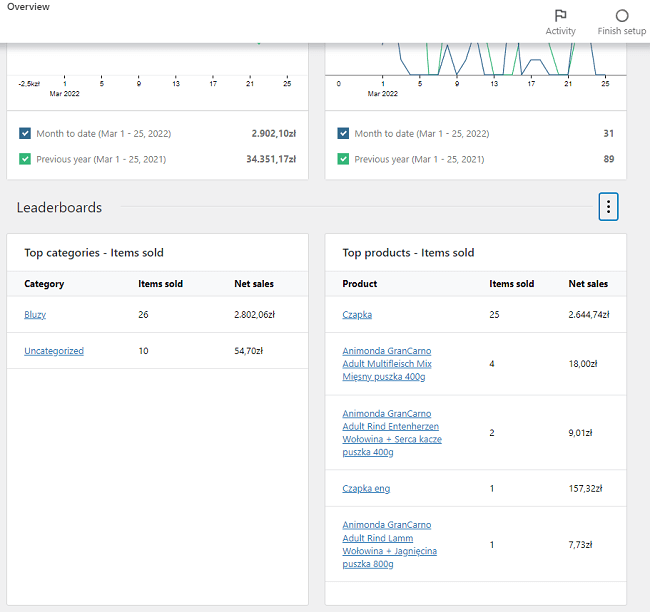
Here you can display leaderboards for different statistics. By default, the Top categories – Items sold and Top products – Items sold are available in the main view.
As with the other two sections, you can use the ellipsis to adjust the displayed statistics, change their order on the page or remove them altogether. Here, you can also select the number of rows displayed in the table. Top customers – Total Spend and Top Coupons – Numbers of Orders are available.
You can rename each of the three available sections in the Overview tab, allowing you to personalize your WooCommerce analytics even further.
Products
This is another available tab, which is similar to Overview in its structure. Here you will find a date range, where you can choose whether the graphs should be for All products, Single Product – you choose a specific product, or Comparison data.
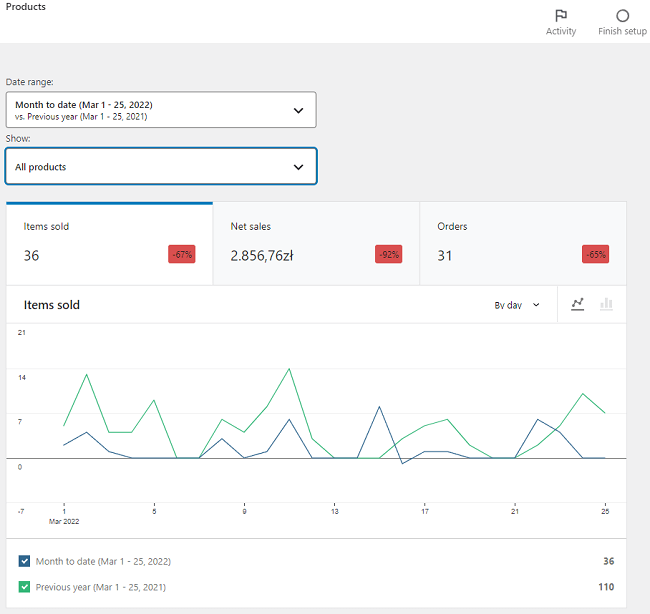
The main panel allows you to track statistics for Items Sold, Net Sales and Orders. A table of products is available below. The multi selector on the right allows you to decide whether the table should include the following data:
- SKU
- Orders
- Category
- Variations
- Status
- Stock
Revenue
The next tab, Revenue, is structured similarly. At the top, you can specify which dates you want the charts to relate to. Below the tiles of individual charts, you can click through. Selecting one of the tiles displays the chart:
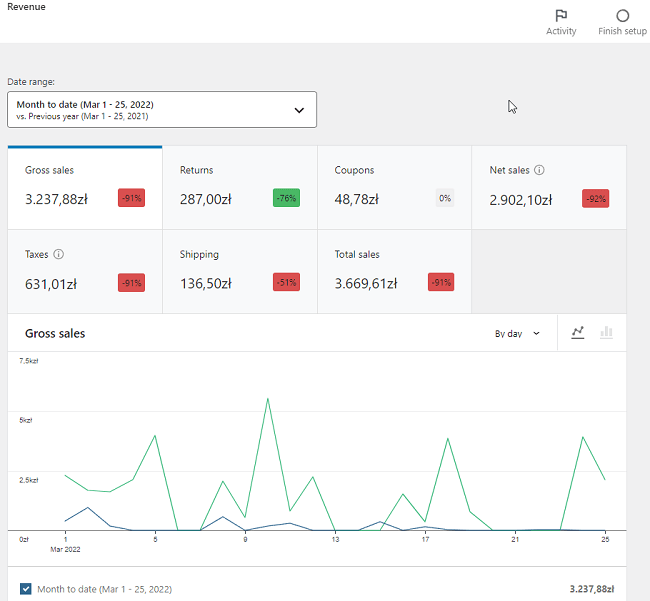
- Gross sales
- Returns
- Coupons
- Net sales
- Taxes
- Shipping
- Total sales
At the very bottom you will find the Revenue table. Interestingly, you can download the data from the table as a CSV file. Before you decide to do this, select the data you want to include in the table from the multi selector menu.
Orders
The Orders tab has a similar layout to Revenue. At the top there is a date range and the content to be displayed, i.e. All orders and… Advanced Filters. As you can see, this is a new option in analytics, but first I will describe All orders.
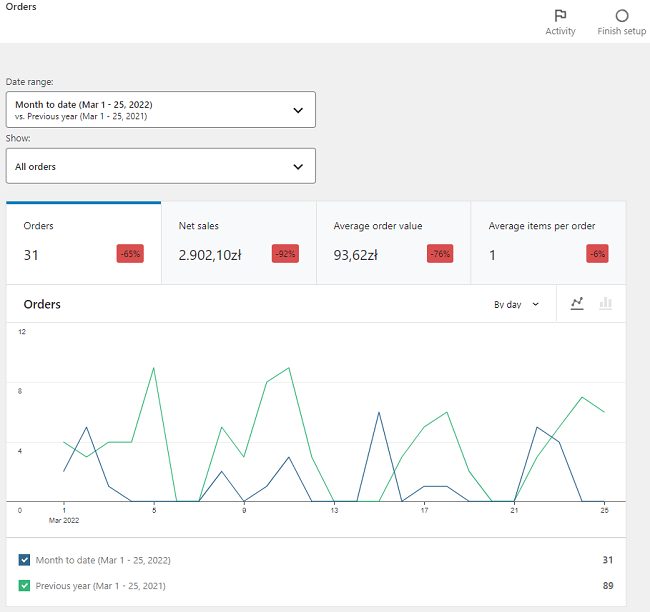
Below there are four tiles: Orders, net sales, Average Order Value, Average items per order. As with the previous tabs, clicking on one of the tiles launches the chart below.
Advanced Filters has an Add a Filter option. The available filters are Order Status, Products, Variations, Coupon Codes, Customer Types, Refunds, Tax Rates and Attribute. Adding each of these triggers conditional logic allowing you to deepen your data analysis according to your preferences. This is a very useful tool to keep track of really itemized data.
The last element of the Orders tab is a table, which can be in the form of a CSV file, and the multi-column allows you to specify the columns to be included in the table:
- Status
- Customer
- Customer type
- Product(s)
- Items sold
- Coupon(s)
Variations
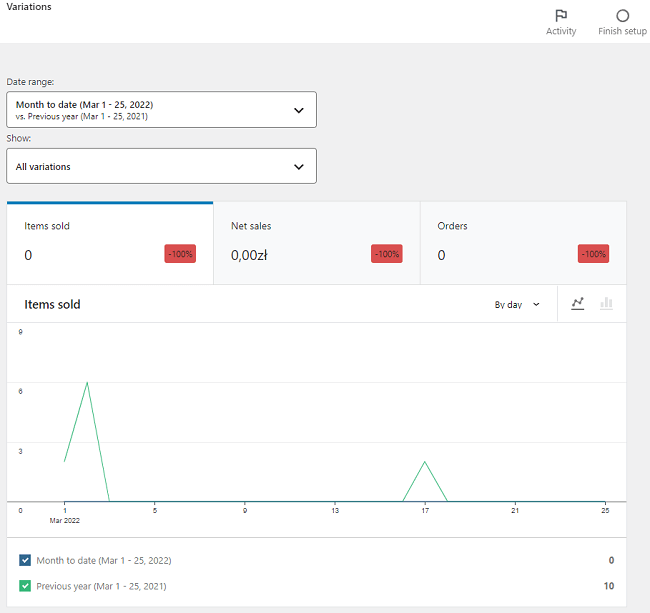
The next tab in WooCommerce Analytics is Variations. Here, as standard, you have the option to select the dates as well as the data to be included in the graphs. There are All Variations, Single Variation, Comparison, Advanced filters. For all selected options, the following data tiles are available: Items sold, Net sales, Orders.
In Advanced Filters we can add the conditional logic for Category, Product, and Attribute.
Categories
In Categories, by default, there is a date range to choose from. You can view data for All categories, Single category. It is also possible to compare data between selected categories. The charts offer data on Items sold, Net sales and Orders.
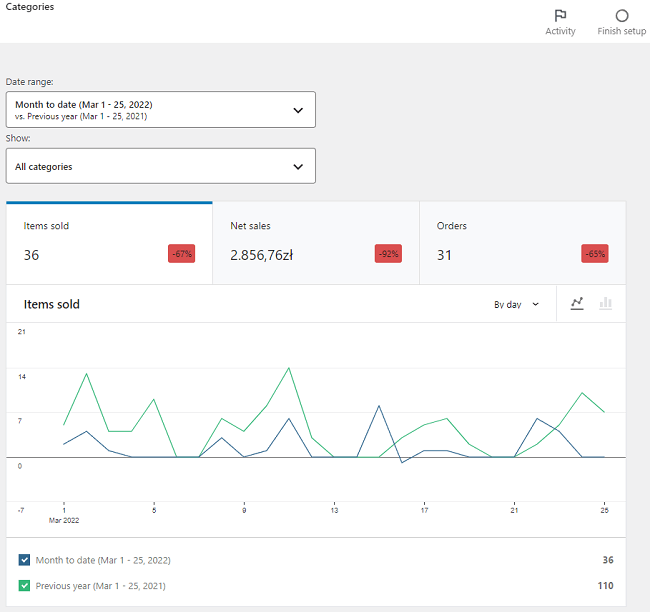
A table of data that can be downloaded as a CSV file containing Net sales, Products and Orders.
Coupons
WooCommerce Analytics offer tab, you will be able to view data relating to coupons. This tab is very similar to the previous one, categories, except that instead of categories, you can analyze All coupons, Single coupons, or choose Comparison.
Also, in this case, you have the possibility to download the data from the table as a CSV file. Menu
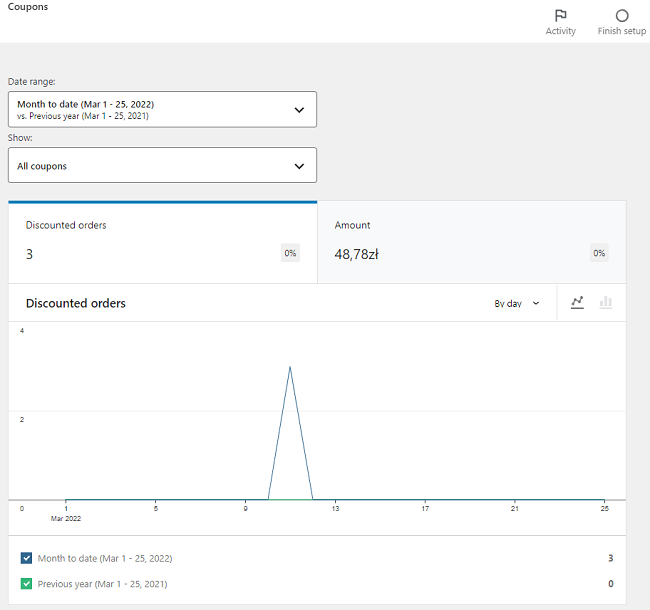
Again, you have the option to download data from the table in the form of a CSV file. The menu below the dotted line allows you to manage the data in the table. Amount discounted, Created, Expires and Type are available.
Taxes
Taxes are a favorite topic for all entrepreneurs, including e-commerce shop owners. In addition to your own date range, you can also select a summary for all taxes that are set in the shop, as well as a comparison of individual tax rates. This is also what WooCommerce Analytics offers.
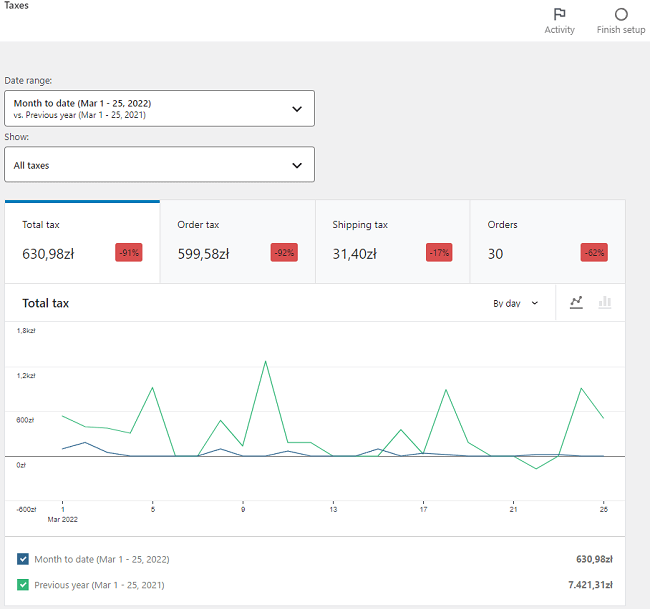
In the tiles with charts below, Total tax, Order tax, Shipping tax, Orders are made available. The Taxes table, in addition to downloading the data to your device, also provides verification of the data in the Rate, Total tax, Order tax, and Shipping tax columns.
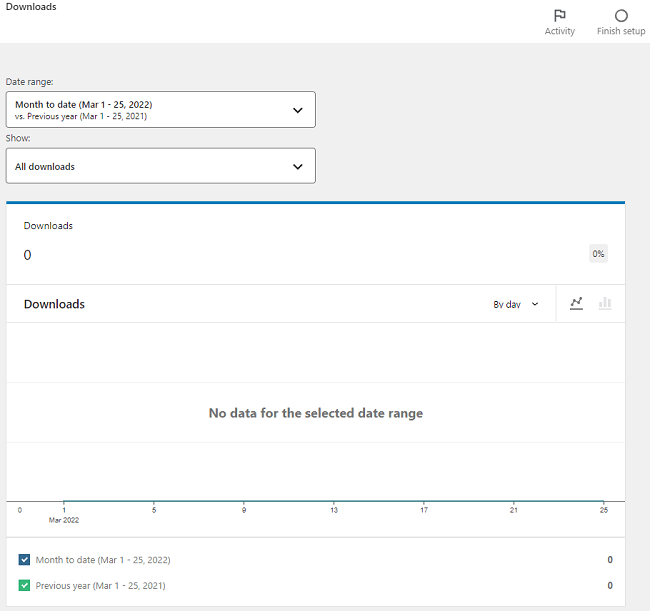
Downloads
It will be interesting for those who sell downloadable products. The Downloads tab offers its own options and gives you available templates with date ranges. It also shows All downloads. It provides Advanced Filters, adding conditional logic for Product, Username, Order, IP Address.
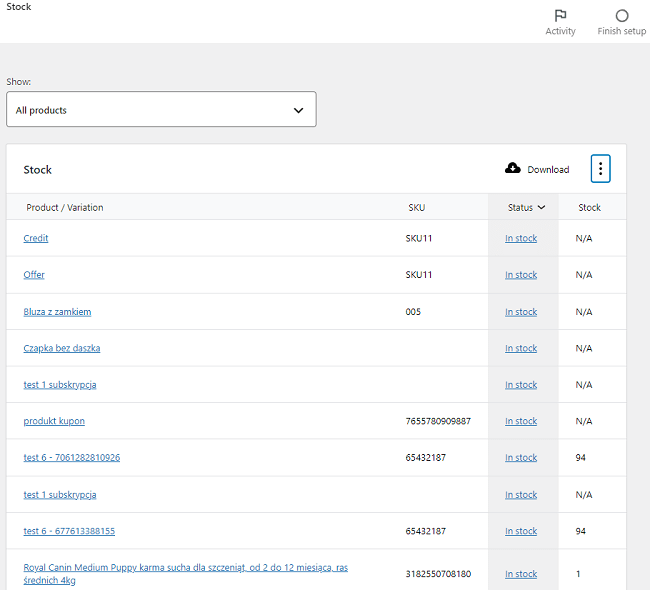
Stock
This is one big table showing the stock of each product. We can group products showing: All products, Out of stock, Low Stock, In Stock, or On back order products. Data from the table can be exported in a CSV file, and under the polygon there is a menu where we can set the table headings. The available options are SKU, Status and Stock.
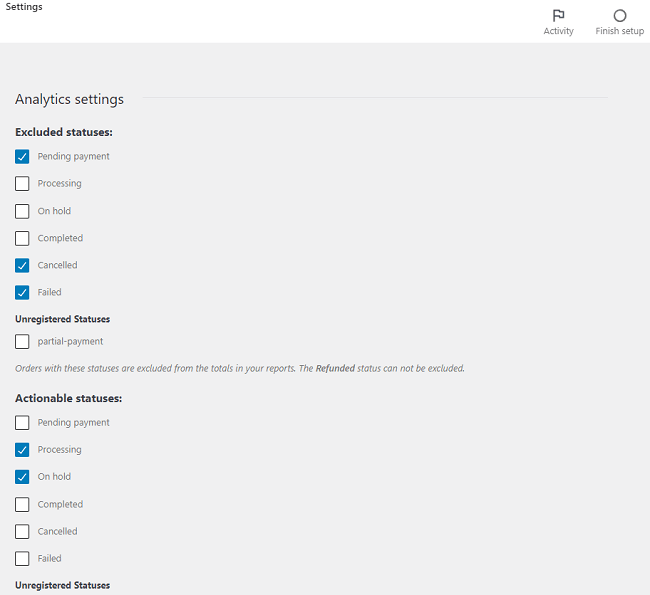
Settings
This is the last tab offered by WooCommerce analytics. We can set which orders (by status) will be removed from the reports and statistics. Also, you may choose which order statuses will need the shop owner’s attention. You have here a choice of all order statuses offered by WooCommerce.
Actionable statuses work similarly to the previous item, except that it concerns Orders with these statuses requiring action on behalf of the store admin. These orders will show up in the Home Screen – Orders task.
Final thoughts on WooCommerce Analytics, Reports & Accounting
There are also filters available in WooCommerce to search for specific invoices issued in the shop. These filters are available with the WooCommerce Invoices Advanced Filters plugin.
As you can see, WooCommerce Analytics is a powerful tool that allows you to analyze various data in the proposed configurations. As a store user, you can also create your own configurations, which will be adequate for your shop. Various filters allow you to go deeper in the analysis to an unprecedented level.
If you would need an invoicing system to get a full picture of sales/refunds and additionally account for this with the tax office, then see our Flexible Invoices WooCommerce PRO plugin, it also has an add-on to help analyse sales based on real sales/receipts and refund levels.
FAQ
How do I correctly set up the WooCommerce Analytics dashboard?
Make sure your settings, date ranges and excluded order statuses are configured properly in the Analytics → Settings tab.
Why are some sales missing in WooCommerce Analytics?
This usually happens when certain order statuses are excluded or when date filters are set incorrectly.
Which metrics should I monitor to improve sales?
Track Net Sales, Average Order Value, Items Sold, Returns and your top-performing products.
How can I connect analytics data with a WooCommerce accounting plugin?
Install a compatible plugin, activate it and allow it to pull data directly from your WooCommerce orders.
How do I export WooCommerce reports for accounting or tax purposes?
Every table within WooCommerce Analytics includes a CSV export option in the top-right corner.